At Bath: Hacked we have lots of data about Bath & North East Somerset. In fact, we have oodles of data; all lovingly gathered, curated & made available on our wonderful Socrata platform for anyone to use.
In this post I’m going to show you how you can quickly turn some of our data into fascinating map-based visualisations using a tool called CartoDB. You don’t need to be able to code – you just need to be able to play.
What is CartDB good for? It’s brilliant for visualising data which have some kind of physical location attached to them. It’s truly stunning if your data also have time information. It’s also a great way to gain different perspectives & insights into what may seem to be an intractable dataset.
Rather than give you a full explanation here of what you can do with CartoDB, I’ve put together a screencast that will walk you through how to add data; have fun visualising, playing with and exploring it; and sharing it with other people.
You’ll need to open some links in your browser to follow along :-
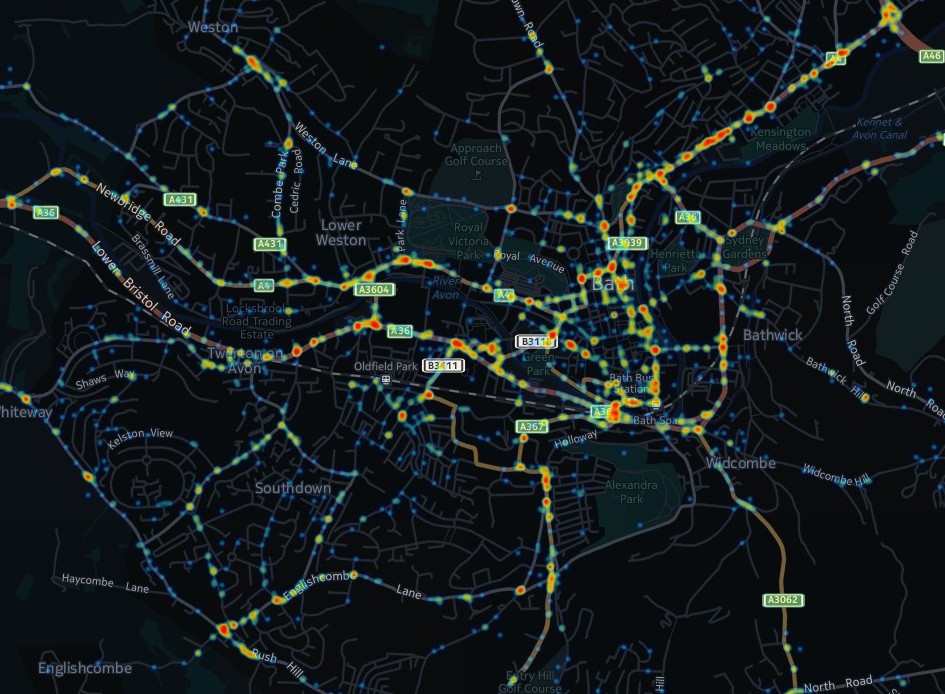
- The dataset we’re going to use as an example, which contains a record of road traffic accidents in the BANES area from 1996-2013.
- The CartoDB website
I hope the video isn’t too long & gives you a good place to start with using our datasets. It’s best viewed full screen, so you can see what is going on. Please let us know if you’d like some help adapting one of our datasets for use with CartoDB.
If this kind of thing tickles your fancy, then come along to our Summers of Data event. We’d love to talk to you about our data & help you get involved with learning more about BANES.