by Takashi Yonenaga (£250 Best Use of Data Award Winner)
What I made
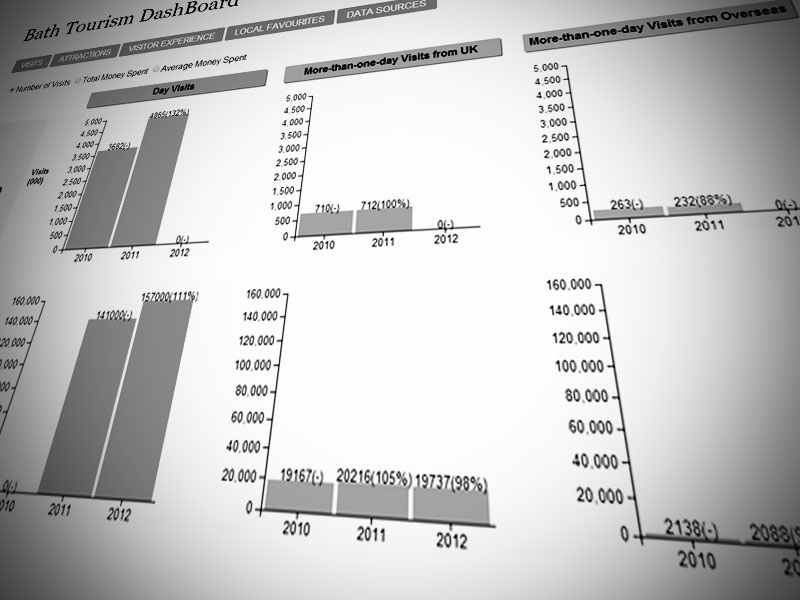
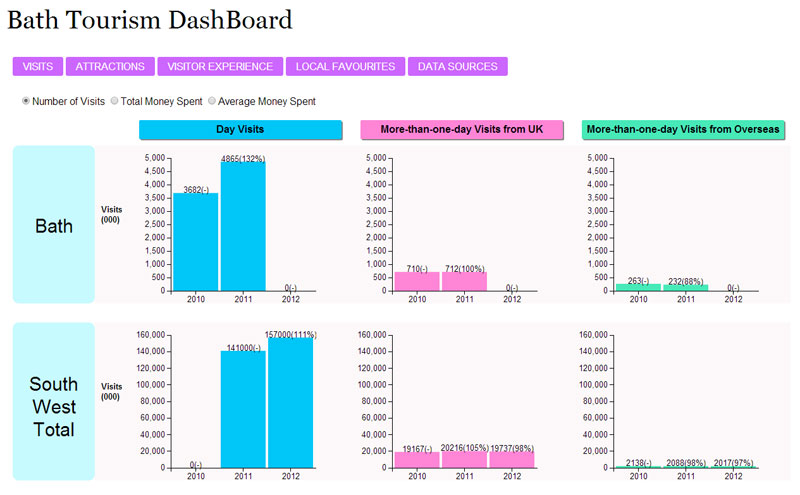
A website that presents some basic stats about tourism in Bath.
Why I made it
Various surveys and data about tourism in the UK are available online; however, they are not presented in a way that allows readers to capture the trends or the driving forces behind those trends in a reasonable amount of time. It is difficult to connect the findings of a survey with those from other similar ones, despite their shared aims. The data and report format lack consistency, which make it cumbersome to break the data down to regional or local levels and compare them with each other.
The dashboard is my attempt to organise these data that are useful and interesting but not necessarily integrated, aiming to make them relevant and accessible to those who are working in tourism industries in the Bath area.
How I made it
Most of the data used are sourced from Visit England. The website is implemented using basic web technologies: HTML, CSS, and Javascript (mainly D3).
What was hard about it
Apart from my coding skills, the challenge was finding the data about the Bath area itself. Its lack somewhat prevented my presenting the data as a long-term trend. Also, it would have been interesting to compare Bath with some other cities, such as Bristol. Seeing the data of attractions outside central Bath would be useful,too.
How I’d develop it further
There are lots of areas for improvement as I do admit that the code is not clean, and the interface is far from sophisticated and attractive. Different types of data and visualisation can be added to make the dashboard more practical and useful. Also I found much potential in the Tourist Routes project, which would give deeper insights about tourists’ visits to key attractions in the city of Bath.
Live project page: people.bath.ac.uk/ty282