Leigh Dodds won Most Educational prize (£150) by using R to show the effects of wind, time of day and seasonality on pollution in Bath.
The problem
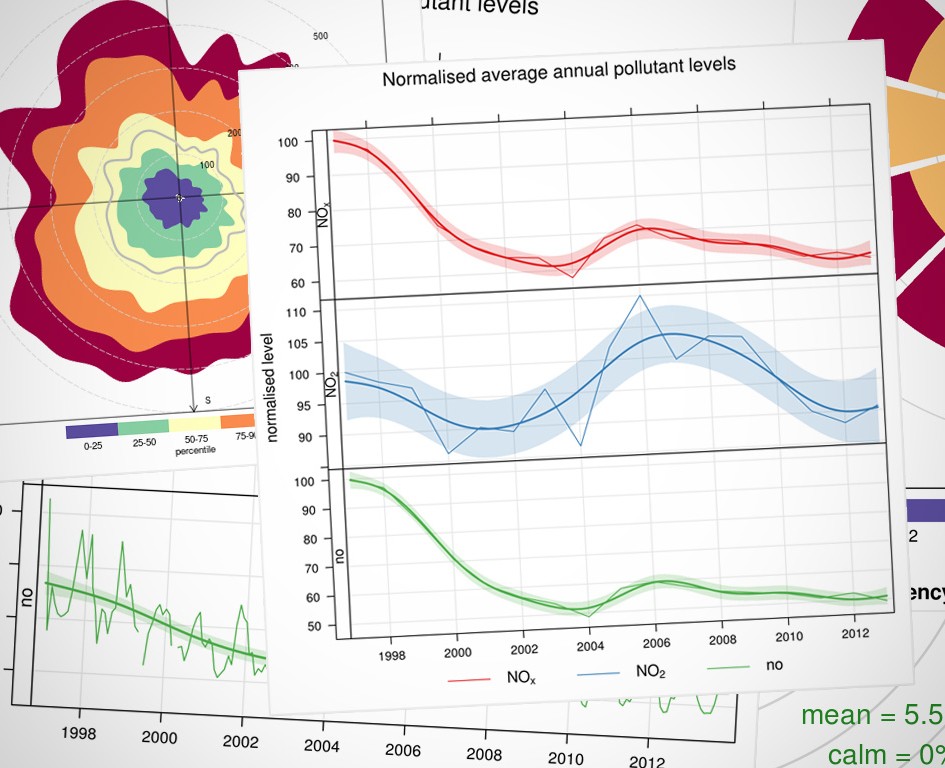
Air quality data analysis is a complex area. There are a lot of factors to take into account including a variety of sources of pollutants, complex interactions between pollutants and impacts from the prevailing weather conditions. BANES publish some summary reports but while informative they didn’t really give me a sense of where the pollution was coming from, or how bad it was at different types of the day or year.
I also discovered the Open Air project which provides an R package to support air quality analysis. It also comes with an amazing set of documentation: the manual is over 200 pages and includes a short introduction to R.
So I read the manual and went into the hack day with a goal of trying to answer two questions:
- Can we provide Bath citizens with more insight into the air quality for Bath?
- Can we provide the local council with new ways to generate meaningful visualisations and summary reports?
The solution
I didn’t get as far as I’d hoped, but I managed to do enough to create what I think is an interesting summary of the data.
Using R and openair I was able to quickly import, normalise and explore the data. In fact R makes it so easy to generate diagrams that I spent a lot of the day just playing with graphs.
I’ve also published the code on github if you’d like to explore. The main report code could easily be customised to use an alternate DEFRA location if you want to try it on some data from your local area.
I’ll certainly be playing more with R over the coming months. I’m sold on the ease with which it’s possible to really quickly explore a dataset.
Team
(A full version is this post is available on Leigh’s Blog at DataSulis)