Or… how I learnt to stop worrying and love administrative geography, it’s an easy way of getting data onto a map.
One of the principles of open data is that it is provided in its most basic form; to most people this means raw files of data, preferably well organised and explained and which is as ‘live’ as possible. But the reality is that government can’t always do that…
The main reason for this is that to release raw data might allow someone to accidentally or deliberately identify an individual and find things out about them without their permission, but a lot of the time, that information is really useful. Sometimes it’s enough to just remove key bits of data from the raw data or change it slightly (such as with the crime data in our datastore)
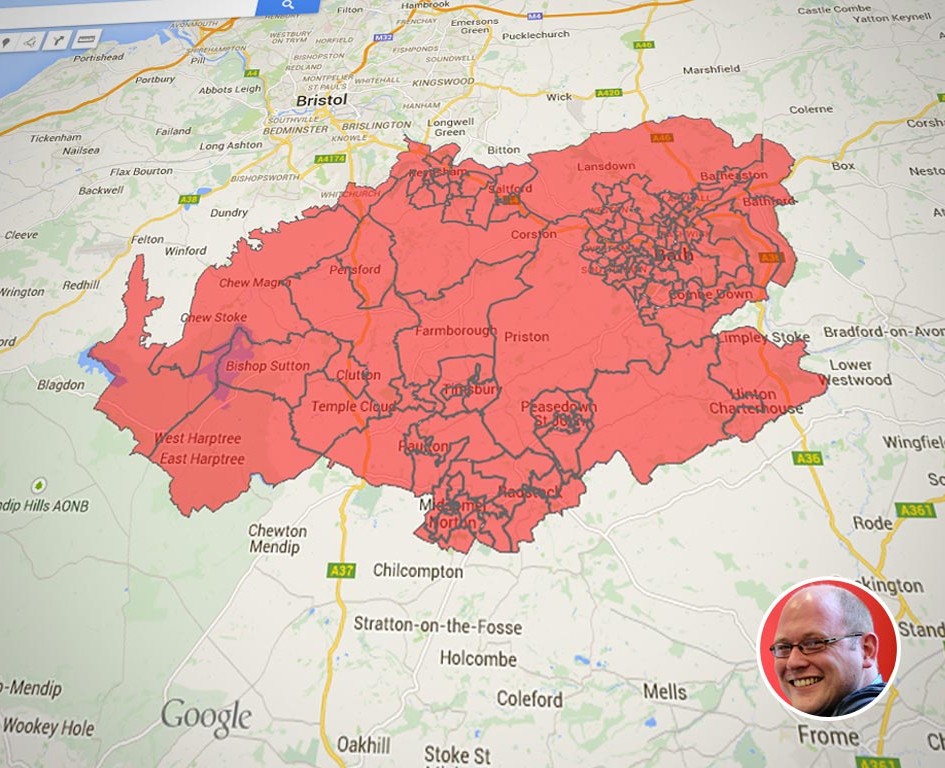
Sometimes government wants to publish aggregate data as well. In these cases they often use the boundaries that have been built by the Office for National Statistics to help with the collection and dissemination of census data. They’re called Output Areas and they’re actually quite nifty. Locally, the council has tended to use a version of output areas called Lower Level Super Output Areas (LSOAs, to their friends):
Download the boundary data from the datastore.
They can be used as a basis for complex visualisations, or simply to mash up local data sources using tools like Google Fusion Tables.
Changes in 2011
The LSOA boundaries published are from 2011, It’s worth double checking any LSOA data you map against the map on this page to check that everything has come through correctly as some data out there will use older LSOA codes from the 2001 census.
There were a small number of changes to the codes outlined in table 1.
Table 1 – Changes in LSOA codes 2001-2011
| 2001 | 2011 |
|---|---|
| E1014406 | E1033080 |
| E1014408 | E1033080 |
| E1014378 | E1033078 |
| E1014378 | E1033079 |
When trying to convert already aggregated data, then the first two can be easily merged and the population breakdowns for the old E1014378 are outlined in Table 2 to enable a modelled score to be created.
Table 2 – Population proportions in split LSOAs
| 2001 | 2011 | Proportion |
|---|---|---|
| E1014378 | E1033078 | 61.86% |
| E1014378 | E1033079 | 38.14% |