As part of our project exploring the Strava Metro data for Bath the first thing we wanted to do was to understand the data at a high level. By taking a step back from the detail we can start to understand what types of insights we can draw from the data.
The first and most important thing to note is the coverage. The extract we’ve been given includes one years worth of activities, starting from 1st January 2015 and ending on 31st December 2015. The data extract summarises activities that were started in Bath during that period, but doesn’t provide any information on the rest of Bath & North East Somerset or the wider local cycle network.
The data also, obviously, only provides information about activities that were publicly logged by Strava users during that period and within that location. A key question for interpreting the data will be: how representative of all local cyclists are the Strava community in Bath?
The Strava Metro FAQ has this to say about how representative the data might be:
“The Strava community is made up of all types of cyclists and surveys have shown that most Strava cyclists do not refer to themselves as competitive. In fact, nearly one-half of all rides on Strava in denser metro areas are commutes so Strava Metro data gives great insight into the needs of those riding for transportation only. Furthermore, in metro areas, nearly everyone is a commuter – either commuting to work, or commuting to the ride they’ll be doing outside the city. Through our own analysis of the data, it is evident that cyclists of all types tend to use the same “best available” roads and paths while cycling in metro areas.”
It’s also important to note that while there is a summary of the demographics of the Strava users in the data, these details are not included in the underlying activity data. So we can’t identify activities recorded by a particular demographic. This is likely because of the chance of leaking personal information.
What types of questions can we ask?
Understanding the coverage, scope and content of the data we now have a better idea of how it can be used.
From what we know so far, we can expect it to help us ask questions such as:
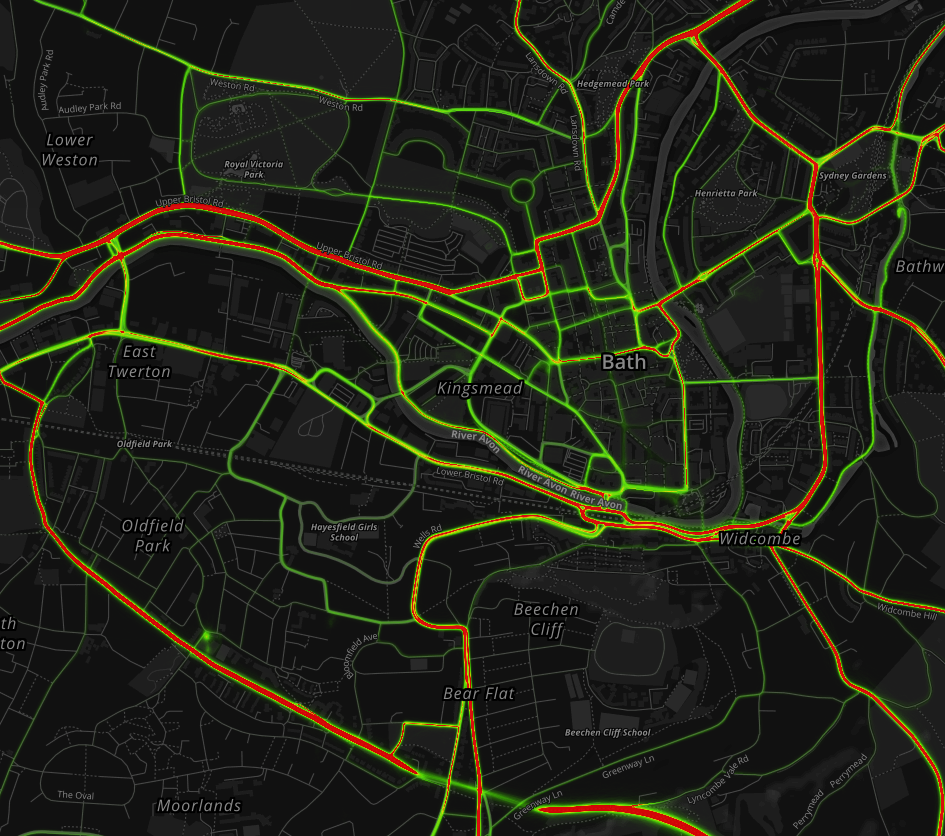
- how are Strava users, and by extension other cyclists, moving around Bath?
- what are the most popular or heavily used routes?
- where are there significant wait times at intersections?
- what are the flow disparities on roads and paths used by cyclists
- when are the busiest times for cycling?
But the data won’t be able to help us answer questions like:
- are there any ongoing annual trends, e.g. changing of cycling patterns in the data?
- how are cyclists using the wider cycle network around Bath and North East Somerset?
- are there differences in cycling patterns by age or gender?
For that we’d need additional data from Strava or other sources.
Strava activity in Bath
The data we’ve been provided with includes 129,568 activities logged by 12,139 Strava users in 2015.
- Around half of the activities have been classified as commutes, either explicitly by the user or via Strava’s algorithms
- 80% of Strava users in Bath are male
To help us confirm that the data is representative we would ideally compare the demographics of Strava users against the wider population of cyclists in the area. Unfortunately the only demographically comparable data available is from the 2011 census, which gathered some statistics about people who said that they commuted by bicycle.
The following graph shows a comparison between the Strava demographic file in our dataset and the 2011 census demographics:
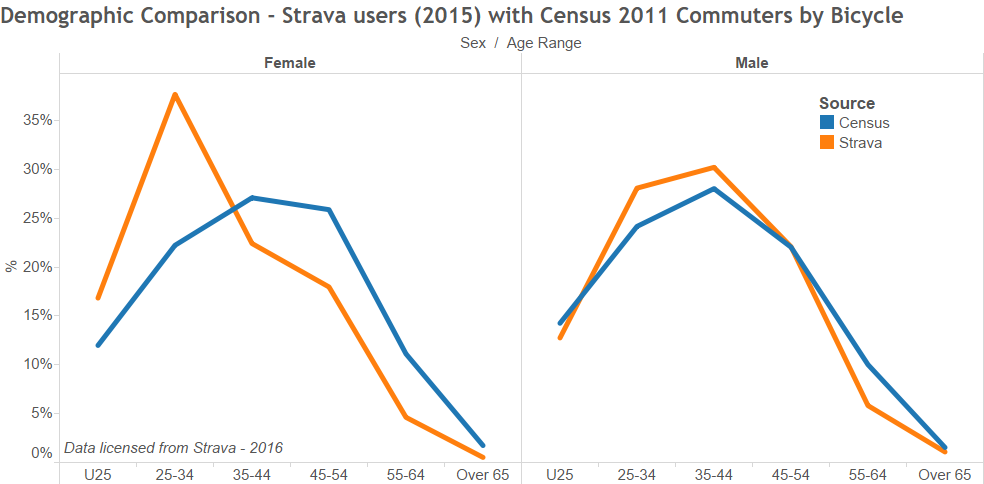
At a proportional level there is a reasonably good fit between the age of users across both sexes. This suggests that the Strava data may be best suited for understanding how regular, heavy-use cyclists are using the transport network around the city. What we don’t have is any comparative demographic data for other categories of cyclist. So we need to take care when making assumptions about other types of usage, e.g. recreational or utility rides.
In the next post we’ll be looking at the profile of cycling activities by time of day, week and season. As ever, we’re interested in your thoughts, so please add a comment if you have any questions or ideas.
We’d like to thank Strava for the opportunity to work with a sample of their Metro dataset. It’s a fantastic insight into cycling activity around the city.
March 16, 2016 at 9:53 pm
Where are people going and able to connect to easily?
Are these recognised as cycleways? Are they as safe as can be?
Where are they not going? But would possibly go to, if the infrastructure was better? This question is hard to answer – because you are trying to prove that IF you build the infrastructure, that people will use it. The thing is, we know that they do – look at the London Superhighways.
Which roads are people riding on, despite them being incredibly dangerous?
I’m thinking of the A4 Keynsham Bypass, (where cars are legally allowed to overtake cyclists at 70 miles per hour)
Marksbury Dual Carriageway, (where cars are legally allowed to overtake cyclists at 70 miles per hour)
Keynsham to Bitton main road,
Can we prove that these have decent usage and should be made safer? And, that if we connected certain towns together – you can see how connecting Bristol and Bath makes the B2B cyclepath massively well used. What if you connected Say, Midsomer Norton/Radstock to Keynsham?
Can you see that for certain routes, because the Cyclepath is not completed, that people just turn around and go back the way they came? E.g. Two Tunnels to the Hope and Anchor? Radstock to Great Elm? If they are very well used, should they be extended to increase their usefulness?