We’re doing a small project to explore how data from Strava can help us understand how cyclists move around the city. We’re looking for questions and ideas from the community. In this post we’re providing some background on the project. In later posts we’ll be showing some of our first visualisations.
Many cyclists and runners will already be familiar with Strava. It’s a social network for athletes that lets them track and share data about their rides and runs, via a smartphone or GPS device. This gives the individual users a variety of benefits including feedback on their performance, ability to compete with friends, and the chance to find routes used by others.
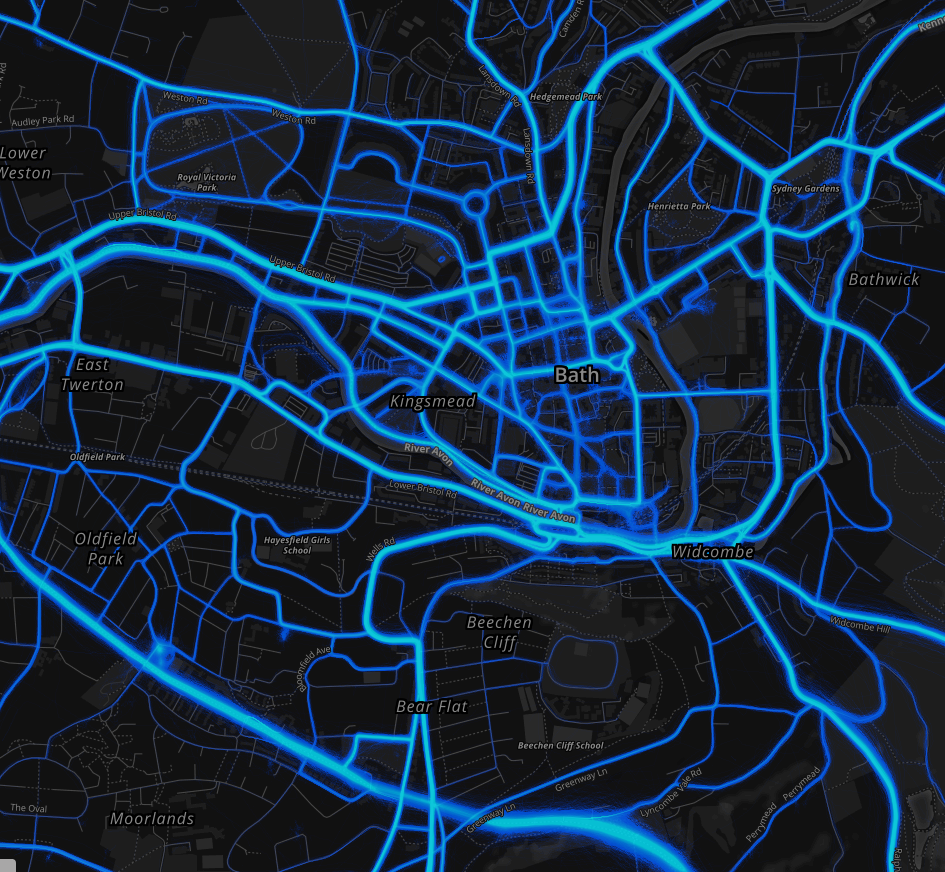
By collecting together publicly logged data Strava can build a picture of how athletes move around their cities and local areas. By analysing the data it’s possible to explore cycling patterns by time of data, week, season, etc. The data is available as a commercial service called Strava Metro. You can read more about it in their FAQ and explore some of the data via their interactive heatmap which shows popular routes in an area.
While Bath: Hacked is an open data project, when Strava offered us the option to explore their data to see whether it could be useful for the local community, we decided to take a look. We didn’t want to miss the opportunity to extract some useful lasting insights.
What we’d like are some ideas and suggestions from the wider community and especially from Bath’s cyclists. Given access to some data on how cyclists move around the city, what questions would you like us to try and answer? The data won’t let us do everything, but by starting from the questions we can work out whether its achievable or whether there are other sources we could use.
To show what’s possible we’ll be posting some sample visualisations of the data over the next few days. To give you a sense of what data has been shared with us the data we’ve been given:
- covers the city of Bath, but doesn’t provide detail on the surrounding areas
- summarises all cycling activity in Bath recorded in 2015
- does not include any personal or sensitive data, and it only includes data that was publicly shared via Strava
- is aggregated data that tells us, for example: how many cyclists went down a specific road, or went through an intersection at a specific time of day
- includes information on wait times at intersections, direction of travel and whether a trip was logged as a commute
- includes some demographics that gives us a picture of Bath’s Strava users
We’re not able to publish the detailed data, but can share any analysis we produce under an open licence.
At the moment we’re most interested in getting ideas for how it can be used. If you’re a developer and are interested in exploring the data, then we can discuss getting access under our data sharing agreement.
If you have some thoughts or questions then please leave a comment on this post!
We’d like to thank Strava for the opportunity to work with a sample of their Metro dataset. It’s a fantastic insight into cycling activity around the city.
March 14, 2016 at 10:28 pm
I wrote a blog post about the Strava heatmap data for Bristol here –
http://curlybrackets.co/blog/2016/03/10/bristol-exercise-insights-strava-global-heatmap/ – I’m interested to see if you can overcome some of my perceived limitations by having access to the underlying dataset.
March 16, 2016 at 6:28 pm
Hey Jon –
good read on your blog. Just a word about the heat map vs the metro data. The heat map is a gps saturation reflection by tiles. So the slower the activity the more gps points km that are collected. This in turn makes those areas loook hotter. for example almost ALL trail networks look super used however you always travel slower in networks.
Cheers
Brian
March 19, 2016 at 9:25 pm
To check as I don’t use strava, on the app can you not set to record by distance instead time as you can on most commercial GPSs?