Continuing our project exploring the Strava Metro data for Bath we decided to begin exploring when cycling activities are taking place at different times of the day, week and year.
Last time we took a high-level look at the data to understand its scope and coverage. Now we’re going to start digging into the detail to begin building up a picture of how cyclists are moving around the city.
The following chart provides a summary of when Strava users are active in and around the city. There’s quite a lot to it, so let’s break it down.
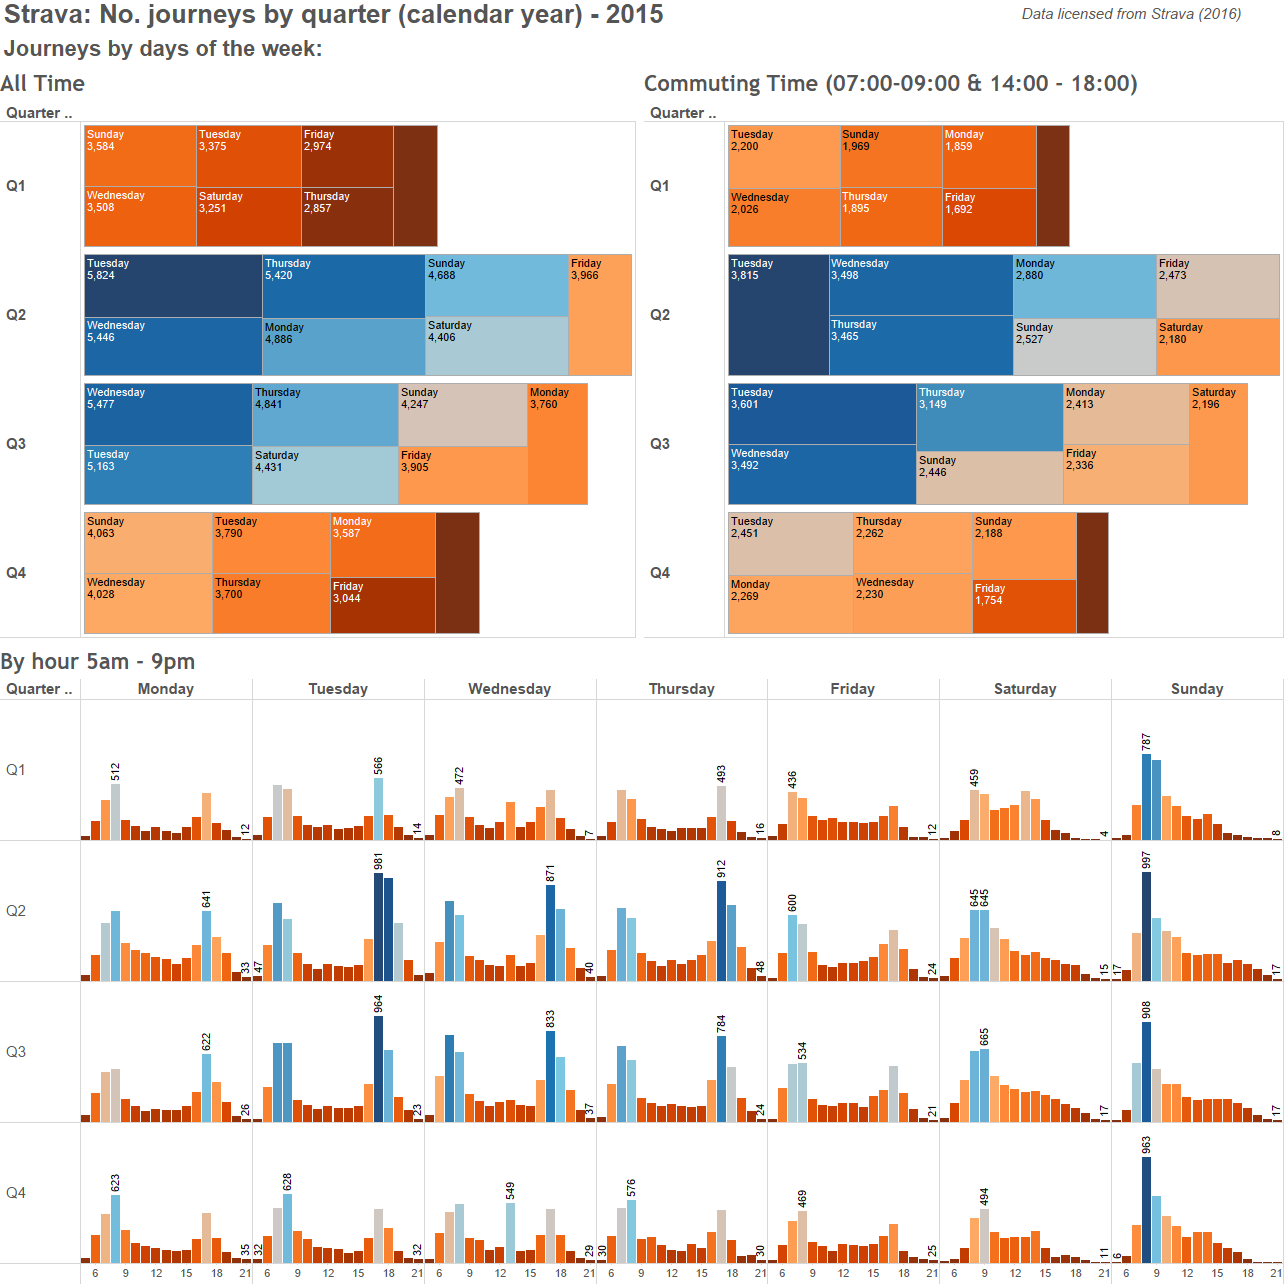
The top half of the chart shows the number of journeys for each day of the week, grouped by quarter.
Days that are shown in blue have the most journeys. Orange and red indicates days with fewer journeys.
Looking at the top-left of the chart you can see that in:
- Q1 (January-March) most of the journeys are on Sundays and Wednesdays.
- but in Q2 (April-June) and Q3 (July-September) its Tuesdays and Wednesdays that are the busiest days
- Q4, its back to Sunday and Wednesday
The comparison on the right hand side just looks at the journeys that took place within normal commuting times. You can see there that Tuesdays and Wednesdays always seem to be the busiest days.
The bottom half of the chart shows a similar breakdown by quarter and by day of week. But in this case we’ve included the time of day during which the activities took place. You can see, for example that in Q2 & Q3 there are definite peaks of activity during commuting hours.
This is already very interesting!
For example, why are Tuesday’s and Wednesday’s so busy? It may be an artefact of small sample sizes and so isn’t statistically significant. Or maybe there’s a regular cycling meetup or other local activities that are held more regularly over the summer?
Saturday and Sunday mornings always seem to be consistently busy times for cyclists. Based on this, if you want a quiet ride, then would going out later in the day be better?
What trends or insight can you draw from the data? We’d be interested to know your thoughts, so please leave us a comment below.
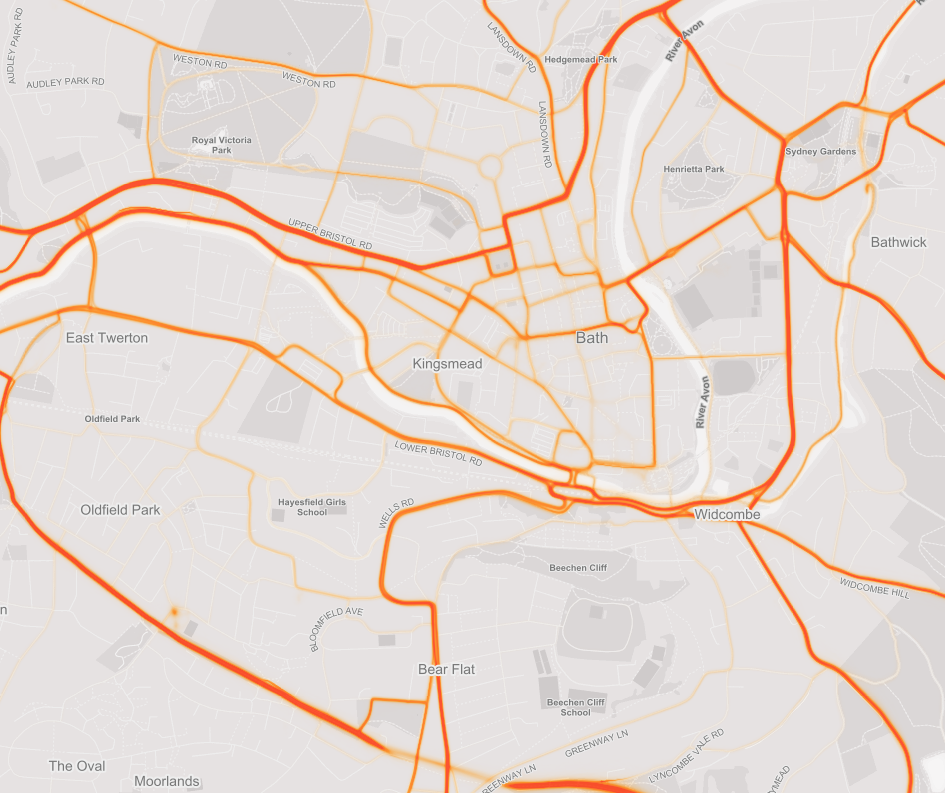
In the next post we’ll demonstrate how the data looks on a map, to add a geographic dimension to our analysis.
We’d like to thank Strava for the opportunity to work with a sample of their Metro dataset. It’s a fantastic insight into cycling activity around the city.
March 16, 2016 at 12:55 pm
As a contributor to this data set I may be able to shed some light on the trends you are seeing. The Saturday and Sunday trend is pretty easy to explain as both the Bath based cycling clubs run group rides at these times. The Tuesday and Wednesday phenomenom is a bit more difficult but there are two factors that I can think of. Firstly, as someone with a reasonably long commute (15 miles each way) I tend to not ride every day of the week. Monday is usually a day off for clothes transporting and letting legs recover from long Sunday rides. Tuesday and Wednesday are then prime commuting days tailing off towards the end of the week. Secondly during the summer there is a racing series on at Odd Down circuit meaning you would have a lot of people riding round in circles for several hours on most Tuesday’s during Q2 and Q3.
March 16, 2016 at 1:35 pm
Thanks for that Barney. A very useful insight which dovetails perfectly with some conversations we’ve had.
March 16, 2016 at 3:18 pm
This data should also be ‘dovetailed’ with the bike riders who, like myself, who don’t upload to Strava.
March 16, 2016 at 3:20 pm
Hi Dave,
Yes, we’ve requested some manual count data from the council which, fingers crossed, may be with us shortly. Then we can do some cross-comparisons.
I think that’s likely to be the only other source of activity data we’ll be able to acquire for now. The public Dept of Transport counts are very high level and are constrained just to major roads.
Cheers,
L.
March 16, 2016 at 6:32 pm
If you can correlate the data to the counters you can really start to make the route and trend data further into the network.
Dave F jump on Strava and vote for cycling!
March 16, 2016 at 3:21 pm
I’m struggling to believe that 33+ unique strava users pass through Bath every day.
March 16, 2016 at 3:25 pm
Hi Dave,
Which statistic are you referring to? The data doesn’t tell us anything about individual users, its how many people were active at different points in the city, at different times of day. The same people might ride at multiple points over the day.
We do know the total number of user accounts in the dataset though, as we reported yesterday.
Cheers,
L.
March 17, 2016 at 11:45 am
Interesting 🙂
That’s my data.. Tuesday is a Bath CC regular ride day, a group of us meet at either the start of the Railway Path or on the first of the month at Batheaston. There’s always at least 6 of us and often 10 or more and several of us are on Strava. There’s also a regular “Hills” ride in the evening (when we’re not racing at Odd Down as Barney explained above).
Thank you for the effort you’ve put into this 🙂